
image text translation
(1)Base Rate 350500 USD Exchange Rate 13,000 KRW KOSPI 241496-039Updated 2023-03-27 000503
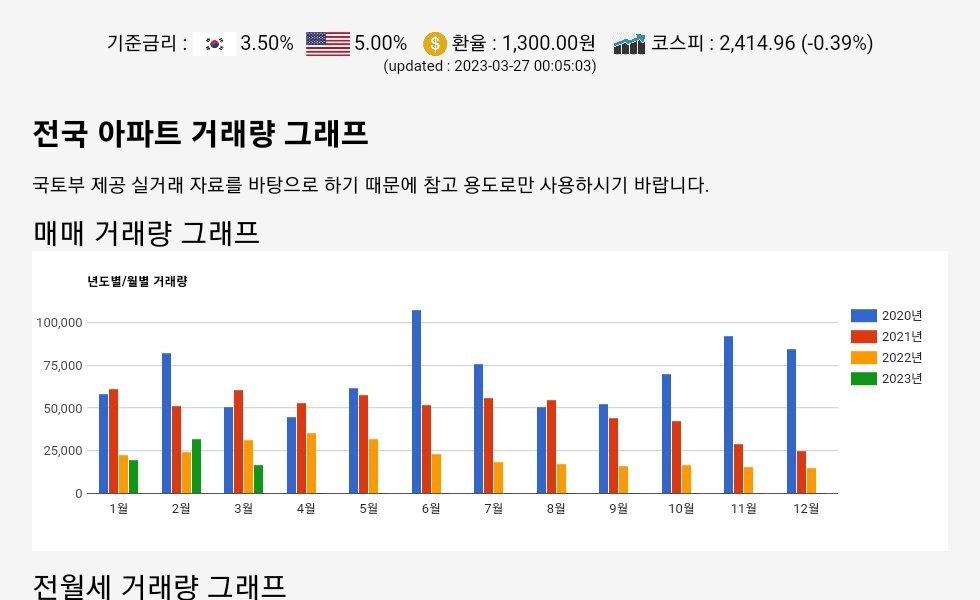
(2)National Apartment Transaction Volume
(3)It is based on actual transaction data provided by the Ministry of Land, Infrastructure and Transport, so please use it for reference only
(4)Trading volume graph
(5)Transaction volume by year and month
(6)The year of 2020
(7)The year 2021
(8)Year 2022
(9)The year 2023
(10)Monthly Lease Volume Graph
(11)2020, 2021, 2022, 2023
(12)National Apartment Sales Supply and Demand Trend Graph
(13)It’s based on data provided by the Ministry of Land, Infrastructure and Transport
(14)The sales and demand index is based on 100, indicating that the lower the demand for a house is less
(15)Trend of sales supply and demand
(16)the six largest metropolitan cities
(17)National Housing Lease Demand and Demand Trend Graph
(18)The Jeonse Supply and Demand Index is based on 100, indicating that the lower the demand for a house is less
(19)Trend of jeonse supply and demand
(20)National Apartment Sales Price Index Graph
(21)What is the actual price index for apartments
(22)The price change of the apartment is expressed as a relative value of 100 as of June 21 at the base time
(23)The actual transaction price index of apartments in area A is 125, which means that it has increased by 25 compared to June 2021
(24)Trend of the sales price index
(25)National Chart of Apartment Housing Price Index
(26)Trend of Jeonse Price Index
(27)Unsold Apartments Across the Countrywide
(28)National trend of unsold houses
(29)Unsold graph after completion of construction of apartments nationwide
(30)an undifferentiated country
(31)New apartment sales nationwide graph
(32)New Tsui Regulations nationwide
(33)Average Initial Apartment Sale Rate Graph
(34)This data is based on the data of the Korea Housing & Urban Guarantee Corporation
(35)Trends in the nation’s initial sales rate
(36)- Other provinces
(37)Q4 2022
(38)Third quarter of 2022
(39)Second quarter of 2022
(40)Q1 2022
(41)Q4 2021
(42)Third quarter of 2021
(43)Second quarter of 2021
(44)First quarter of 2021
(45)Fourth quarter of 2020
(46)Third quarter of 2020
(47)Real Estate Market Consumer Sentiment Index Graph
(48)Data created based on data is expressed as a value between 0 and 200, and the index is primarily generated for each survey item, and in the case of 9 rising countries, 1 to 3 falling phases, 1 to 3 falling phases, the index is smaller than 5 and relative error level
(49)○ This means that there are many responses to the classification stage of the most real estate market by adding price increase or transaction increase step by step
(50)Consumption field generated index
(51)○ Depending on the index value, ~3
(52)Face 95-sided descending yarn classified into a straddle
(53)Monthly Announcement Data Book of the Year
(54)Trends in the Consumer Sentiment Index
(55)January 2023
(56)December 2022
(57)November 2022
(58)October 2022
(59)September 2022
(60)August 2022
(61)July 2022
(62)June 2022
(63)May 2022
(64)April 2022
(65)National Home Purchase Burden Index Graph
(66)It’s based on housing finance statisticsSystem
(67)Housing purchase index means that middle-income households have a standard loan index of 91, and the higher the number of home purchase mortgage loans of about 25 to 901 of moderate-priced government-paid income, the greater the burden of housing purchase
(68)The index indicating the burden of repayment in the case of purchasing a house at an intermediate price is that the principal and interest are reimbursed in the case of housing
(69)Ex to buy
(70)Ji
(71)G100
(72)Seoul, Busan, Daegu, Incheon, Gwangju, Daejeon, Ulsan, Gangwon, Chungbuk, Chungcheongbuk-do, Jeonbuk, Jeonnam, Gyeongbuk, Gyeongnam, Jeju, Sejong
(73)Q2 2022 75
(74)Q1 2022 7520484 79 94 61 84 62 116 40 41 43
(75)Q4 2021 7419982
(76)Q3 2021 6718271 7381 50 56 102 33 35 37
(77)Q2 2021 641736772 4869 54 93 32 33 30 29 27 38 67 140
(78)The average actual transaction price of apartment sales is 10,000 won per graph
(79)This data is based on the data of the Korea Real Estate AgencyAverage Price Trend – Gwangju
(80)apartment
(81)November 2022 413 1280 457
(82)October 2022 379
(83)September 2022 379 1248 423 388 488 341 402 331 554
(84)June 2022 405 1407 415 386 493 364 402 336
(85)April 2022 453 1501422
(86)March 2022
(87)Chart on the ratio of lease price to apartment sale price
(88)This data is based on the data of the Korea Real Estate AgencyThe rate of change in apartment lease prices
(89)February 2023 669536 638 700652
(90)January 2023 675 547 643 706 661 704 697 743 636 7638 780 790 77995 765
(91)December 2022 682559
(92)November 2022 686 569651 720 678 714 702756
(93)September 22, 2022 689
(94)August 2022 689574651 726 680 732 702 757 663 768 785 789 788 777 794 754 637 471
(95)July 2022 689 573 651 727 681 733 703 755 663 768
(96)Construction Cost Index Graph
(97)This data is based on the research of Korea Construction TechnologyThe price of agricultural, forestry, and fisheries products used in this index can be compared with the wholesale successful bid price, but it cannot be used for construction price measurement other than direct construction costs
(98)○ The variable price index of the price range is the absolute level negative
(99)The time series between the new and old indexes was connected according to the consumer price index, producer price index, and index level, not the sales price
(100)prayer and successful calculation
(101)Subsequent measures in progress other than the results presented in this data shall be used for misuse or prior approval for research by processing or citing the construction cost index
(102)a construction talk
(103)No stone
(104)Construction costs
(105)Construction Cost Index
(106)Construction Cost Index
!