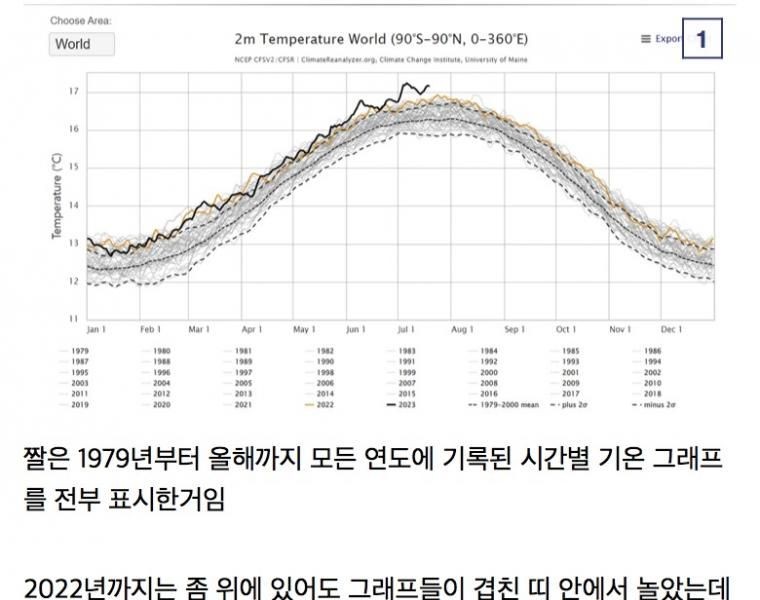
(1)GIF is a graph of hourly temperatures recorded in all years from 1979 to this year
image text translation
(2)It’s a complete display of
(3)Until 2022, we played in overlapping bands with graphs, but this year, the graph suddenly popped up on its own
(4)But it’s only displayed until mid-July, so I looked to see if there was any update
(5)Data updated by Sept. 30 still takes a long way off the existing graph band
(6)And then I’m playing on top
(7)This is a graph of sea surface temperature, but it’s fine at first. Suddenly, I’ve been flying high off the graph since May
(8)Changes in the number of days of heat wave due to climate change
(9)※ RCP 85 if greenhouse gases are emitted as is the current trend
(10)2021-2040 2041-2070 2071-2100
(11)Ministry of Data and Environment Meteorological Administration
(12)I think the children who are being born now are poor
(13)Global Greenhouse Gas Emissions in Major Countries
(14)Unit GtCO2-eq Giga CO2 conversion tonnes as of 2021
(15)No. 1 China
(16)weight by country
(17)4 Russia
(18)4 Countries
(19)10 Canada 070
(20)11 Korea
(21)21 England 042
(22)22 France 1041
(23)23 Italy 041
(24)Data from the Korea Federation of Businessmen
(25)Reporter Kim Min-ji Yun Yeon-jeong Intern 20231024
Global climate situation estimated to reach 2050 is drawing data that is expected to break through in 2023